iRankx Logo

Case studies

Proof you can check with your own eyes.

Real results from real client properties, shown in full below with the figures visible in every screenshot.

Case studies

Results that speak louder than words.

Five real Google Search Console screenshots, presented as full case studies. Each one is numbered, named for the trend its chart shows, and carries the figures visible in its own screenshot. This is the standard of proof you should expect before spending anything.

Google Search Console, Performance

Case Study 01, Featured

Riding wave after wave of demand

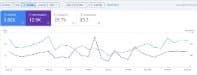
Clicks and impressions roll in steady, repeating waves across the whole period, the signature of a property plugged into recurring search demand. More than a million impressions turned into tens of thousands of clicks, at an average position inside the top ten.

32.6K

Total clicks

1.02M

Total impressions

3.2%

Average CTR

9.3

Average position
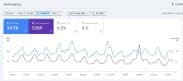
Google Search Console screenshot showing 32.6K total clicks and 1.02M total impressions

Google Search Console, Performance

Case Study 02

The result searchers cannot skip

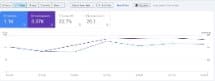
An average CTR of 22.3% is the headline here: more than one in five searchers who saw this result clicked it. Visibility is being converted into visits at an exceptional rate.

2.89K

Total clicks

12.95K

Total impressions

22.3%

Average CTR

15.3

Average position

Google Search Console screenshot showing 2.89K clicks, 12.95K impressions, 22.3 percent average CTR and 15.3 average position

Google Search Console, Performance

Case Study 03

Climbing in from the deep pages

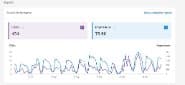
An average position of 20.1 across the period, with clicks and impressions building together in the trend lines: a property working its way in from the deep pages toward the results that matter.

1.9K

Total clicks

22.7K

Total impressions

20.1

Average position

Google Search Console screenshot showing 1.9K clicks, 22.7K impressions and 20.1 average position

Google Search Console, Performance

Case Study 04

Seen everywhere, clicked every day

Just under a thousand clicks against 99.4K impressions: this property is being seen across a wide spread of searches, and the steady daily rhythm in the chart shows those impressions turning into clicks day after day.

996

Total clicks

99.4K

Total impressions

Google Search Console screenshot showing 996 total clicks and 99.4K total impressions

Supplied screenshot, shown as provided

Case Study 05

The spike that says it all

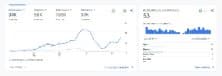
One chart, no summary needed: traffic builds, spikes to a sharp peak, dips, and climbs back again. This is what momentum looks like before it settles into a trend.

Screenshot shown in full, exactly as supplied.

Supplied performance screenshot showing a traffic chart that climbs, spikes and climbs again